Aprs.fi user guide
This is the official manual for the aprs.fi web service. This is also a Wiki page, so you're welcome to expand the document!
Introduction
The aprs.fi web service collects information from the Automatic Packet (or Position) Reporting System Internet network (APRS-IS). APRS is used by amateur (ham) radio operators to transmit real-time position information, weather data, telemetry and messages over the radio. A vehicle equipped with a GPS receiver, a VHF transmitter or HF transceiver and a small computer device called a tracker transmits it's location, speed and course in a small data packet, which is then received by a nearby iGate receiving site which forwards the packet on the Internet. Packets are also retransmitted on the radio channel by digipeaters to enhance the coverage of the system. Systems connected to the Internet can send information on the APRS-IS without a radio transmitter, or collect and display information transmitted anywhere in the world.
In addition to that, aprs.fi also displays AIS data transmitted by most large ships. AIS transmissions are received by volunteers at numerous sites, but most areas are largely uncovered.
This guide aims to become a comprehensive manual for the aprs.fi web site, and as such does not attempt to describe the APRS or AIS systems in detail. To get started with APRS, please consult the following pages:
- Wikipedia: Automatic Packet Reporting System
- G4ILO: APRS - Putting ham radio on the map
- K9DCI: APRS Beginner Guide (PDF)
AIS is described well on the Wikipedia page for Automatic Identification System.
Languages and localisation
The aprs.fi service has been translated by volunteer users to numerous different languages. The language shown to you will be selected based on your browser's language preference settings. If you wish to preview the site in different languages, please prepend the two-letter language code to the site URL:
- http://fi.aprs.fi/ - aprs.fi in Finnish
- http://ja.aprs.fi/ - aprs.fi in Japanese
- http://en.aprs.fi/ - aprs.fi in English
The site also supports different measurement units (metric, imperial and nautical), which can be selected in the preferences.
Each page has a set of navigation links at the top of the page, and another at the bottom. On the real-time map, the links are provided in the navigation bar the right side of the map, which can be hidden by clicking the button in the top right corner of the page.
The general idea is that the links on the top provide links to different data views. If you have already looked up a specific station, the links will contain that callsign, and clicking on the weather link when viewing the info page of a weather station will give you that station's weather history graphs.
The links at the bottom page provide links to static content pages such as the FAQ and this user guide, which give general information about the whole site.
There are a few exceptions to these rules, of course – the My account and Moving stations links, for example.
Real-time map
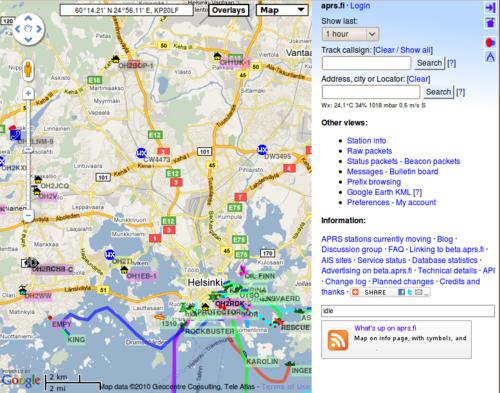
The real-time map which opens up first when you arrive on the site displays, in nearly real time, APRS and AIS data on top of maps or satellite images provided by Google Maps. By default, it opens up showing the real-time situation in an area which should be relatively near your current location. The location guess is based on your IP address and it is a bit rough, but usually it opens up at least in the correct country. It is possible to select and save an initial view, but more on that later!
On the left side of the map you'll find the familiar Google Maps map controls which can be used to zoom and pan around the map. You can also use the mouse to drag the map, and the wheel of a mouse (if you have one) to zoom.
On the top of the map there is a box showing the coordinates and locator currently under the mouse pointer, a controls to switch between different map layers (street map, terrain map, satellite images and hybrid satellite+street map), and a control to enable additional layers on top of the map (traffic info, bicycle routes, and so forth).
On the right side of the map is a menu area containing the search boxes, links to switch views, links to information pages, and possibly some advertisements or links to news about the aprs.fi site. Near the bottom, right above the advertisement is a small status box which indicates the rather frequent updates of the real-time map data. The updates normally happen once every few seconds.
Clicking on any of the ship or vehicle symbols will open up an info balloon showing current information on that tracking target.
Controlling the amount of data displayed
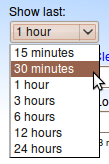
Near the top right corner there is a drop-down selection for the amount of history shown. When looking at the real-time view of an area (and not tracking a station), the maximum setting is 24 hours. Beware – if you're looking at a busy area, or have zoomed out to see a lot of APRS stations, selecting 24 hours will likely make your browser slow down to a halt, just because it needs to display so many symbol graphics and path lines.
If you're tracking a single target, the maximum selection is 7 days.
If you're having trouble with the map being too slow, or the browser freezing, please take a look at the troubleshooting section.
Searching for an APRS callsign or AIS vessel
The first input field in the top right corner of the page, labelled Track callsign is used for looking up a specific station by it's amateur radio callsign. Ships can be looked up by either their names (which are not always unique) or by their unique MMSI numbers (think of it as a phone number for the ship). Enter the callsign of the station in the box and click on Search. The most recent known position of that transmitter will be shown. For example:
(Please right-click the link and select Open in new window or new tab to avoid navigating away from this page.)
After looking up the station, no other stations in the area will be shown. You can bring other stations into view by clicking on Show all, while still tracking the selected station. If the tracked station moves, the map will center on the new position.
To stop tracking stations, click on Clear. This will reset the page to a real-time view at the same location and zoom level.
Looking up multiple targets at the same time
It's possible to search for multiple targets at once by separating the callsigns or names with commas:
SSIDs - identifying multiple stations owned by the same operator
More often than not, a single amateur radio operator has multiple stations: one at home, one in the car, and maybe a hand-held walkie-talkie too. These are identified by their SSID (Secondary System Identifier) numbers, which range from 1 to 15. OH7LZB could be the home station, OH7LZB-9 is probably the car, and OH7LZB-14 could be a motorcycle. After you have successfully looked up one of these, links to the other available SSIDs for that station are shown below the search boxes. The ones which have recently transmitted their position are shown with a larger font.
Searching for an address
The second input field on the right searches for an address, a city, or a QTH locator. Given a specific address it will center the map at that address. Example searches:
- Kuopio - searches for the city of Kuopio in Finland.
- Paris - searches for the city of Paris. It is quite likely to jump to Paris, the capital city of France, but if you are located in the USA, it might as well come up with the city of Paris in Illinois, USA. Many city and town names are not unique!
- Paris, IL, USA - searches for Paris in the state of Illinois, USA.
- Paris, France - searches for Paris in France.
- Paris, FI - searches for a Paris in Finland, and manages to find Pariisinkatu (Paris Street) in Helsinki.
Enter the components of the address from the most specific to the least specific, separating them by comma characters. For example:
In other countries and languages, use whatever addressing system is typically used. Google understands many languages. As an example, here is the Japanese address for the Kyoto tower. Zoom in and switch to the satellite view:
The address lookup service is provided by Google Maps, and functions similarly to maps.google.com. In other words, if it doesn't find something, it's Google's fault.
Coordinate search
You can also enter coordinates in the address search box in several different formats:
QRA locator search
Given a Maidenhead / QRA / QTH locator aprs.fi will center on the locator's middle point and draw a rectangle around the locator's borders. For example:
You can also check the coordinates and locator of a position on the map by simply pointing at the position with your mouse and reading the coordinates from the box in top left corner of the map.
Looking up historical data
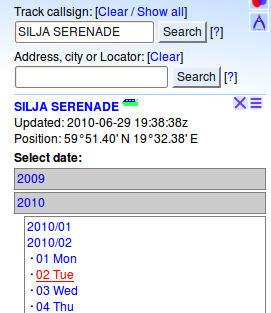
To view past positions of a station, first look up the current position. A date browsing menu will appear on the right, consisting of the years for which data is available on aprs.fi. First, click on the year, then select the month, and finally, select the day you wish to view. The menus might open up a bit slowly at first, since aprs.fi needs to consult it's huge historical database to check the availability of data for the station in question.
aprs.fi normally stores position history data for about a year. If you wish to retain your tracks for a longer time, please use the Data export tool to download a KMZ file for offline viewing using Google Earth.
Tool buttons
In the top right corner of the real-time map you'll see a set of buttons. These are used for controlling different tools on the real-time map.
The hide button hides and displays the menu bar on the right, effectively switching to a full-screen mode of a sort.
The home button jumps back to your initial view, which might be a very rough guess of your location, or a specific view configured by yourself.
The PHG button toggles between no PHG circles shown, half-size PHG circles and full-size circles. The PHG circles display estimated service areas of APRS digipeaters and igates. They are very rough estimates or guesses made by the operator of each digipeater and usually they are not based on any exact statistical measurements.
The center button requests your current location from your web browser and centers the map on that location. The browser needs to support the Geolocation API for this to work, and for accurate positioning a GPS device is needed. This works especially well on new mobile devices such as the iPhone, iPad and Android-based phones.
The share location tool requests your current location from your web browser and shares it on aprs.fi. Like the center button, this requires Geolocation API support, but you also need to create an user account on aprs.fi and log in using the user account. Please be aware of the privacy implications of uploading your location on the Internet. While the information can be deleted from aprs.fi on the My stations page, it is often sometimes close to impossible to remove something from the Internet, since others might have already downloaded the information and uploaded it to numerous other places on the net.
The favourites button displays a list of your favourite stations on aprs.fi. The list can be used to quickly recall those stations. The favourites list is stored on the aprs.fi servers together with your user account, so you need to be logged in for it to work. The favourites list can be edited on the My stations page.
The ruler button enables the ruler tool, which can be used to measure distances and bearings on the map. After clicking on the tool button, click somewhere on the map, and a marker will appear. Use the mouse to drag the marker to another position on the map. Another marker will appear from below the first one, a line connecting the two will be shown, together with the distance and bearing from point A to point B. You can also click the markers to see the exact coordinates of the marker. Multiple rulers may be placed on the map at the same time, just click on the button again to start from the beginning!
Selecting an initial default view
You can save the current map view, including the map type, zoom level and tracking settings, so that they will be recalled when you next open up aprs.fi. It's a good idea to do this especially if the initial guessed location is far off from your area of interest.
- Click on Preferences to open up the settings window. It's under the Other views title.
- The first item in view is Save current map view as default view. Check the checkbox.
- Click on Save at the bottom of the page.
The preferences are stored in your browser's cookies, so they will not apply when you open up aprs.fi on another computer or using another browser. You do not need to have an user account aprs.fi to save the preferences. The rest of the settings in the Preferences dialog are described in the Preferences section of the document.
Street View
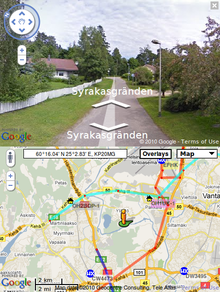
Google's Street View has been integrated in aprs.fi, allowing you to view street-view panoramic photos on the site.
You can open Street View by dragging the yellow pegman (from above the zoom control) to the map. When dragging the pegman, a yellow overlay will indicate the roads with panorama photos. Drop the pegman on a road and the panorama will open. You can drag the panorama to look around, and click on the arrows to advance along the streets.
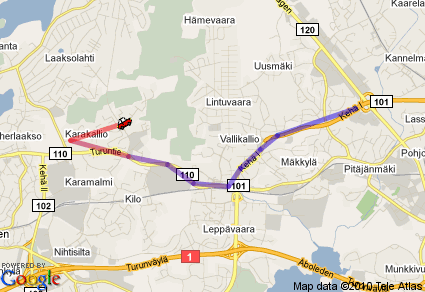
If you click on Track in Street View in the info balloon of a station, the panorama which is closest to the current location of the station will be opened. You can also click on any red track point along the path of a station to jump there (or any other station, for that matter). When a currently tracked station moves, the Street View jumps to the new position automatically.
If the clicked station is transmitting a course (which generally requires that the station is moving), the Street View will open up pointing to that direction. If the station is not transmitting a course, the camera will point from the panorama picture's center coordinates (where Google's camera was when the panorama was taken) to the exact coordinates transmitted by the stations. This implies that clicking on a house symbol of someone's home station will often open up a photo of that house (with antennas on top).
If no panorama photos are available for the required position, the Street View will close automatically. Unfortunately no error message is shown at this point – better feedback for Street View errors will be implemented later.
For more information on Street View, please consult Google's Street View documentation.
Packet path lines
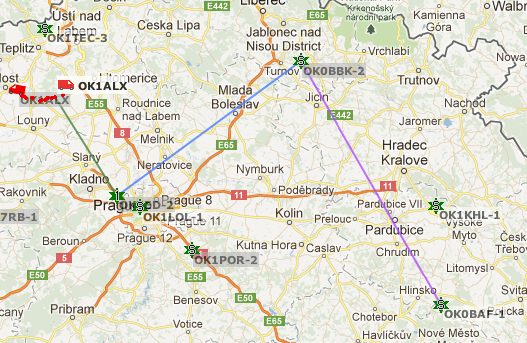
When you bring the mouse cursor on top of an APRS station or a red track point, a line indicating the packet's known path over the APRS network is drawn. The line should traverse via the digipeaters and end up at the igate listed in the packet's path. If you are not tracking a station, the line will only be drawn via digipeaters and igates which are visible (or just outside the visible area). When you track a station, the used digipeaters are loaded on the map even if they are outside the visible area.
The path taken by that position packet is shown in the info balloon. In this case, the packet's destination callsign was APZMDR, it went through the digipeater OH7RDA, was transmitted with an original path of TRACE2-2 (requesting two digipeater hops) and received by the igate OH7AA.
There are a lot of digipeaters in the network which still do not add their callsign to the path when retransmitting the packet. Because of this the path display is often incorrect and shows some incredibly long hops.
Clicking the right mouse button on the real-time map opens up a context menu, which can be used to trigger actions specific to that location.
Add marker
Creates a new temporary marker, which can be moved (drag-and-drop). The markers can be used to temporary mark locations and initiate further actions on those locations, such as creating labelled links. The markers will be forgotten as soon as you navigate away from the real-time map. Multiple temporary markers may be created at a time.
Clicking on the marker opens up an info balloon, displaying the coordinates for the marker, and the action links.
Clicking on Link to this position generates a link with the coordinates, which can then be sent over an email or IM conversation. Clicking on the link will open up the map at those coordinates, showing a marker on the specified position. You can also add a descriptive label in the link by typing it in the provided input field. The label will be shown in an info balloon when the link is clicked. For example:
Center map here
Centers the view on the specified location.
Keyboard shortcuts
- Arrow keys – pan the map
- Page up, Page down, Home, End – pan the map quicker, one page at a time
- +, - – zoom in/out
Common search features
Searching using a wildcard
If you don't know the exact callsign or name of the target, you can try to search for it using wildcard characters. The * character will match any number of any characters, and the ? character will match any single character. For example:
These searches will bring up a wildcard search result page. Because the original search was made from the real-time map which supports displaying information for multiple targets at the same time, you can either click on a single callsign to view that stations' position, or check the checkboxes on the left side of the callsigns and click on Show selected to start tracking multiple stations at the same time. Many views on aprs.fi, like the Weather page, do not support multiple targets at the same time, in which case the checkboxes do not appear on the wildcard search result page.
Date range selection
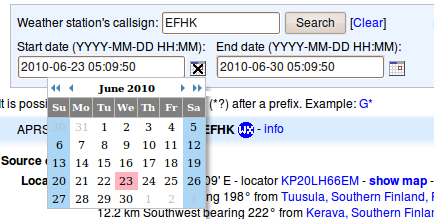
Some pages, including the weather and telemetry pages, support selecting an arbitrary date/time range. The start and end dates must be entered in numeric year-month-day format. 2010-11-12 stands for the 12th of November, 2010. Leading zeroes can be omitted, so 2010-5-3 will bring up the 3rd of May.
You can also click on the calendar icon to bring up a calendar tool which helps with the date input.
Table sorting
Most of the tables shown on the aprs.fi web site can be sorted by most or all columns shown. Just click on the column title to sort in ascending order (a small arrow pointing down will appear), and click again to sort in descending order.
Info page
The info page summarizes most information aprs.fi has on an APRS station, item, object or AIS vessel. It shows the collected information in a table, a small static map with the most recent received position, and provides links to other pages with more details and history.
- Comment
- The station's comment text, transmitted together with the position.
- Last status
- The most recent status message transmitted.
- Location
- The last known location of the station. The coordinates are shown in the preferred format (see Preferences if you wish to change this). A maidenhead QTH locator is also shown, and a list of some cities or towns which are close, together with distance and bearing from the each town to the station.
- Last position
- The time when the last known position packet was transmitted.
- Course
- The course information from the last position packet (if available).
- Speed
- The speed information from the last position packet (if available).
- Last telemetry
- The most recent telemetry measurements received.
- Last WX report
- The most recent weather report from the station.
- Last path
- The APRS packet path from the last position packet, complemented with the APRS digipeater path advisor, where applicable.
- Positions stored
- The amount of position packets stored in the database.
- Packet rate
- The average interval between packets.
- Other SSIDs
- A list of other APRS stations having the same callsign but different SSID. The ones which have recently sent a position are shown with a larger font.
Path advisor
If the packets seems to have originated from the RF side of the network, the path advisor will comment on the relative "goodness" of the packets APRS path settings. The advisor report appears right after the Last path on the info page. It will count the amount of total hops the packet seems to have traversed, and if the number is higher than 3, the path is considered suboptimal.
The advisor also suggests using the New-N paths of WIDE1-1,WIDE2-1 or WIDE1-1,WIDE2-2 which seem to be the most commonly accepted paths. It also gives advice on invalid usage of RELAY and WIDE1-1 when they're not the first component of the path, and suggests replacing RELAY with WIDE1-1.
There are different opinions on "good" settings, and there are regional differences too. I believe the settings offered are good for most environments. It doesn't really matter so much if one uses TRACE or WIDE, as long as the total amount of digipeaters isn't very large. 2 is good in areas with good coverage digipeaters and igates, 3 is usually good elsewhere. 5, 6 or 7 is, well, not good.
Packet rate advisor
The info page also gives advice if the packet transmit rate seems high. It calculates the arithmetic mean (average) interval between recently transmitted packets. If the average interval falls below 30 seconds, the following advice is shown:
This station is transmitting packets at a high rate, which can cause congestion in the APRS network.
If the interval falls below 15 seconds, the following advice is shown:
This station is transmitting packets at a very high rate, which causes serious congestion in the APRS network. This could be considered an abuse of the network resources.
Up to last 50 packets from a station are considered, but the backwards-going lookup stops at the first 1-hour gap between packets, the intention being to look at the last or current trip of a vehicle. The interval is only calculated if there are at least 3 packets in the last trip. Because an average is used, this shouldn't trigger too easily from bursts generated by Smart Beaconing.
There are some ideas how to make this more meaningful. I've been thinking of an algorithm to calculate some sort of fuzzy "network loading" value by multiplying the packet rate by the amount of digipeater hops requested in the packets and using the result to trigger the nagging. This would allow a higher rate to be used with no digipeater path, but trigger more quickly when a 3-hop path is used. It would also handle proportional pathing by looking at the path of each packet separately.
Nearby stations
This is a table of other nearby stations which have transmitted their position within the past 30 days. To see a longer list, click on show more.
Stations heard by X, and stations which heard Y
aprs.fi collects monthly summaries of digipeater and igate statistics. The info page shows both a table of digipeaters and igates which heard the given station, and (if the station is a digipeater or igate) which other stations where heard by that station. The most recently updated entries are shown using a larger font.
These statistics are usually somewhat correct, but there are several caveats, and as you've probably heard – there are lies, damn lies, and statistics.
- A lot of digipeaters do not add their own callsign in the packet's path when retransmitting a packet. aprs.fi cannot possibly know about those.
- A lot of digipeaters do callsign substitution instead of insertion, replacing original path components. A packet with a path of OH7RDÖ,WIDE2-1 could have been a WIDE1-1,WIDE2-1 packet in the first place, and gone through OH7RDÖ and another unknown digipeater.
- The aprs.fi "first heard" algorithm tries to go on the safe side: if it's not sure, it doesn't count as directly heard. But even then, some incorrect overly long paths are shown.
- Stations transmitting invalid or fake coordinates will skew these statistics. If the transmitting station claims to be 1000 km away (due to a bad GPS fix), my best guess can only be that the station actually is that far away.
- Items and objects are not shown here, since they are usually far away from the transmitter which transmitted the packets.
Info graphs
On the info graphs page various station statistics are shown in diagrams:
- Amount of APRS packets transmitted per hour
- New positions received per hour (positions which are actually new and different from the previous transmitted position)
- Reported speed of the station
- For digipeaters, igates and AIS receivers:
- Amount of packets heard per hour (very much underestimated, due to APRS-IS duplicate filtering)
- A monthly receiver performance report
- For igates:
- The amount of packets gated to the APRS-IS per hour (underestimated due to duplicate filtering)
Graphs for which no data is available are not drawn. Currently, the graphs only go back a few days, but this will probably improve in the future.
- OH7RDA, a digipeater, does not show a speed graph, but there is a nice receiver distance report in the end.
Static maps
Since the real-time map is quite heavy on computing resources, and appears slow (or does not work at all) on many old devices and mobile phone browsers, there is a Static map feature. It even supports looking up multiple stations at the same time, but due to technical limitations cannot show real APRS symbol graphics in that mode.
It is designed to be very simple and lightweight, and it should work fine on small devices or with slow Internet connections.
KML: Viewing APRS positions in Google Earth
In addition to the real-time map on top of the Google Maps, aprs.fi also exports the real-time APRS view in the KML format so that it can be viewed in Google Earth. Google Earth provides a very nice 3-dimensional view which is especially useful for viewing flying objects such as planes and balloons. From the GE site:
Google Earth lets you fly anywhere on Earth to view satellite imagery, maps, terrain, 3D buildings, from galaxies in outer space to the canyons of the ocean. You can explore rich geographical content, save your toured places, and share with others.
Once you have installed Google Earth, you can click on the Google Earth KML link on the right side of the real-time map.
If you are tracking one or more stations, Google Earth will open up tracking those stations. Once Google Earth has started up:
- Open the APRS tracking tree under Temporary Places on the left side of the earth.
- Open APRS.
- Open X points of Y stations.
- Double-click a station to zoom in on it's current location.
If you're not tracking a specific station, simply zoom in at the area of interest. The KML view will display at most 1000 stations at a time, and a warning will be displayed when the limit is met. Zoom in to reduce the amount of stations in view.
Weather display
aprs.fi collects and displays weather reports transmitted on the APRS-IS and the CWOP networks. Weather stations are shown on the real-time map with a blue WX symbol, and clicking on the marker will show the latest weather report received from that station.
If there are weather stations visible in the real-time map view, an average current weather report for the area is calculated from their reports and shown on the right side of the map, just below the address search input form:
Wx: 20.1°C 65% 1013 mbar 0.4 m/s NW
Weather stations with a CW-prefixed, numbered callsign are taking part in the Citizen Weather Observer Program (CWOP). Most other weather stations are amateur radio operators with a weather station. Some information is also converted by individuals from publicly available sources like airport weather reports.
Viewing weather history graphs
The weather report page displays the current weather report for a single weather station, and history graphs for the values measured by that station. It can be easily accessed from the real-time map by clicking on the show weather charts link in the info balloon of the station.
Telemetry
APRS stations can transmit measured analogue and digital telemetry such as voltages, temperatures, and switch / alarm statuses. aprs.fi collects the data and presents it on the info and telemetry pages. The telemetry page allows looking up historic data over the past year.
- VK3RAW, like many other Australian digipeaters, reports temperature, battery voltage and transmitter PTT keydowns using APRS telemetry.
- OH2RCH, an igate running the aprx software, reports channel busy status and received packets.
Telemetry is currently only collected for stations which have transmitted a position packet. This is a bug and will be fixed in the future.
Preferences
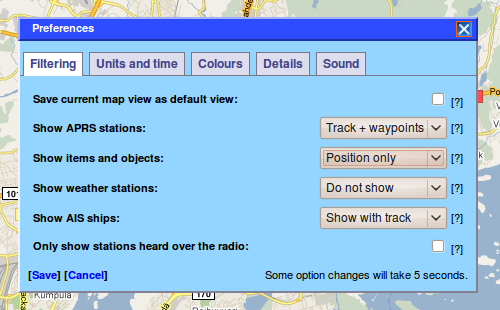
The preferences pop-up dialog allows you to customize aprs.fi to your liking. The settings are saved in a cookie within your browser, so if you switch to another computer or another browser, you will have to tune the settings again.
The settings are organized in tabs. You can go through all of the settings on all the tabs, and then click on Save in the end, which will store and apply all the settings and close the Preferences window. If the window is on the way and you wish to monitor the map behind it, you can drag it in a different place within the browser window.
Filtering
This tab sets limits on the targets which are displayed on the real-time map, controls how they are displayed. Currently there are only four classes of stations:
- APRS stations
- Items and objects
- Weather stations
- AIS ships
In addition, there is an option to filter out positions of stations which did not transmit their position over a radio channel.
This tab also hosts a check box to save the current map view as the default view.
Units and time
This tab lets you select your preferred measurement units (metric, imperial, nautical, Celsius, Fahrenheit), time zone settings, coordinate and locator formats.
Colours
This tab lets you tune the track line colours shown on the real-time map.
The tracking targets shown in the map are divided in 5 groups using the modulo operator – seemingly randomly, but each station will always get the same colour. Here you can select the colours for each of the five target groups so that the colours won't coincide with the ones used for roads in your area.
You can also choose the track line width.
Details
Here you can select which details are shown in the info balloons of the real-time map.
Sound
This tab is used for configuring sound effects in the real-time map.
Messages
The message browsing page displays APRS chat messages sent between users. Initially it shows the most recent messages seen on the APRS-IS. If you look up a callsign, you will see all messages sent by or destined to that call. Messages sent by the station are shown with a red background, and received ones are shown in green.
aprs.fi currently does not have the possibility to transmit messages (or any other type of data), it serves only as a place to view data.
Status messages
Status message packets are shown in the status message page. Initially, if opened without a callsign, it will let you browse the stations which have transmitted status messages, sorted by callsign. If you look up a callsign, you get to browse old status messages transmitted by that station over time.
Difference between status messages and comment text
Status messages are often confused with the comment text. They're another method to send some descriptive status message for the station, the difference from comments being:
- The comment text is transmitted in the same APRS packet with the position, as text right after the position data. aprs.fi associates the comment message with the position.
- The status message is transmitted in a separate APRS packet, such as the following one, together with a timestamp. On aprs.fi, the status message is stored separately from the position, and they can be browsed using the status message page.
2010-07-02 10:09:00 UTC: CT2XXX-11>APU25N,WIDE3-3,qAR,CT1AKV:>282308zUI-View32 V2.03
As you can see from this example, the timestamp is quite often invalid, so it is ignored by aprs.fi. In practice, you can put your descriptive message in the comment text or the status message. It is not wise to put the same text in both comment and status, as it will then be sent twice, which will place unnecessary load on the busy APRS network.
Beacon packets
The beacons page shows packets received from the APRS-IS but which were not identified as APRS packets at all. They are typically identification beacons sent by network nodes, usually describing their hardware or software.
 2010-07-02 03:44:07 UTC: DB0EMS>UIDIGI: UIDIGI 1.9
 2010-07-02 03:44:38 UTC: DB0UAL>ID: DB0UAL * X-NET-DIGI * -9k6 Shift
Bulletin board
APRS bulletin messages are used for sending local announcements to other APRS network users. The aprs.fi Bulletin board page shows all bulletins which have been transmitted recently and passed on the APRS-IS. The page allows looking up custom bulletin groups using the links provided in the beginning of the page.
Raw packets
The raw packets page allows you to browse and inspect APRS packets received from the APRS-IS. When you load the page initially (or click Clear) it will show the most recent APRS packets received. The previous and next buttons can be used to browse older ones. If you click on Raw packets in the real-time map while tracking a station, you will automatically get the packets sent by that station.
Invalid packets (and ones which are valid but which are not supported by aprs.fi) are shown in red, together with an English error message. Unprintable non-ASCII characters are displayed in hex with a purple colour. <0x1c> stands for a byte which has a hex value of 1C (28 decimal).
To see a hex dump of the complete packet contents (revealing difference in whitespace: tabs, amount of space characters in the end of the line), move the mode selector from Normal to Hex.
To view the decoded contents of the packets, switch to the Decoded mode. This will display what information the Ham::APRS::FAP APRS packet parser is able to find from the packets, and is very useful for understanding the contents of mic-e and compressed format packets. aprs.fi internally uses the open-source Ham::APRS::FAP parser for decoding.
Prefix browsing
The prefix browsing pages allow you to search for APRS users by the callsign prefix. It's useful for finding APRS users near you, even if they haven't transmitted for a while and are not shown in the real-time map.
Exporting and downloading position data
The APRS data export tool allows you to export and download APRS positions from the aprs.fi database. An aprs.fi user account is required for using this tool. If you have not logged in already, a login form will be presented.
The tool can export to KMZ format (zip'ed KML + embedded symbol graphics in the same file) which can be opened in Google Earth, and some third-party software tools can also digest the KML file inside the KMZ archive.
It can also export to CSV which opens up nicely in Excel, and both JSON and XML (for the programmers out there).
- Enter the callsign of the station you wish to export
- Specify the time range you're interested in, maximum 30 days
- Click on Search
- A preliminary report of the export results is shown, including the amount of points found in the time range
- Select the output file format, and click Export
- The export file will be generated and downloaded.
This feature is aimed at people who wish to download their balloon's track afterwards, or their path to Dayton and back. It's not aimed at people who wish to download the whole aprs.fi database, so it's rate limited quite heavily – you can only use it a few times per day. Also, it's not an API.
Export file format
The KMZ format is described by Google's KML documentation.
The CSV file is comma-separated, with dates in YYYY-MM-DD HH:MM:SS format in UTC.
Coordinates are provided in decimal format, north and east being positive. Other measurement units are metric: speed in km/h, altitude in meters, distance in kilometers.
The JSON and XML files use the Unix timestamp format (seconds since 1970-01-01 00:00:00 excluding leap seconds), which can be converted to UTC using gmtime() and local time using strftime() functions (and their relatives in other programming languages).
Tools for network operators
The aprs.fi service has several features designed for APRS digipeater, igate and AIS receiver owners.
Heard statistics
aprs.fi collects statistics about the receiver coverage of each igate and digipeater. This feature (and it's deficiencies) are described earlier together with the info page. This data is also used for the following features.
Receiver range calculation
After a sufficient amount of packets have been determined to be received directly by an APRS igate or digipeater during a month, a normal receiver range is calculated. It is normally recalculated after every few hours. The range is displayed on the station's info page, and also plotted as a vertical line in the monthly receiver performance graph in the info graphs.
- Normal receiver range estimate: 80 km (Updated: 2010-07-04 09:49:39 UTC)
This means that the station doesn't usually hear packets transmitted much farther than 80 km away. It does hear something from 80-90 km away, and maybe very rarely from much farther away. These statistics have 10 km resolution for up to 200 km, 100 km resolution until 2000 km and 500 km resolution from there on. A monthly receiver performance graph can be seen on the graphs page, with a dotted vertical line marking the estimated normal receiving range. The longest distances are usually caused by bad GPS fixes or corrupted packets. The range is only calculated when the receiver has directly heard at least 3000 packets during the month, so that the estimate is somewhat accurate.
Heard map
This map overlay illustrates the receiver coverage of an igate, digipeater or AIS receiver. It is not very accurate thanks to the APRS protocol and digipeater implementation issues described earlier, but it does give you some idea about the performance of each site.
Red colour indicates more position packets heard from the area, blue colour indicates less packets. Packets received during the current month are shown.
- OH2RCH is an igate with a pretty good coverage, thanks to it's 100-meter antenna tower.
It is also possible to view the combined coverage of two receivers:
Gated map
This map overlay illustrates the service area of an igate, together with the digipeaters in the area. The service area is generally much larger than the area where packets are received directly. Position packets which were gated by this igate during the current month are shown.
Like the Heard map, this view supports looking up multiple igates at the same time:
Troubleshooting
My position is not showing up on aprs.fi
If your APRS position is not showing up on the site, the most common problem is incorrect symbol setting in the tracker. Please check the raw packets to see the error messages (enter your callsign and click on Search). If you have a problem with the symbols, please check the APRS symbol configuration page on the APRS Wiki.
You should also check if your positions show up on other sites such as DB0ANF and findu.com. If the positions are not showing up on the other sites, the problem is most likely in your tracker's configuration or the local APRS network (or lack of it). Please get in touch with either another local APRS user, or your tracker's user group. Many of them are listed on the google group's front page.
If the positions are showing up on other sites but not aprs.fi, please check the raw packets again. aprs.fi is sometimes a little bit stricter than others about the packet syntax correctness, especially when it comes to symbol settings, and might reject a broken packet which others digest happily. Sorry about that.
My vehicle's position is jumping back and forth to old positions
This can happen due to many reasons, including:
- Your tracker transmitting packets very often, increasing the chance that they arrive at aprs.fi in the wrong order
- Your tracker transmitting packets with a very long digipeater path, increasing the chance that they arrive out-of-order
- A dysfunctional digipeater buffering packets for a long time before retransmitting them
- An igate with a bad Internet connection buffering packets before getting them on the APRS-IS
- A broken digipeater or igate mangling the contents of packets, so that the duplicate packet looks a little bit different than the original and won't be detected by the duplicate detection algorithms
The first two are easy to fix. The second two are harder to track down, but their effects can sometimes be mitigated by reducing the transmitting rate and using a shorter path, so that the packets do not go to a faraway broken digipeater.
aprs.fi tries hard to filter old positions, but sometimes they still get through. Because APRS packets do not contain sequence numbers and usually do not contain timestamps, it's hard or impossible to properly catch the duplicates.
There is a long blog post describing issues with duplicate and delayed APRS packets on the aprs.fi blog.
The real-time map does not show
This application makes heavy use of Javascript and Cookies. Make sure your browser allows aprs.fi to use both. If it asked for permission to use these when you first arrived on the site, and you didn't allow it at that time, the selection was probably stored in your browser's configuration, and you'll need to go to the security preferences menu to change that.
The page layout looks funny or strange
At my workplace, there are sometimes problems with the web proxy server, and the CSS files defining the style and layout fail to load, resulting in a broken layout. This can be cured by doing a "power reload" by pressing CTRL and clicking the reload button (on IE). On Firefox, it's SHIFT-reload, and on Mac Firefox, you need to keep the Apple (Command) key down while clicking the reload button. Alternatively, you can try clearing the browser's cache (temporary files).
If this doesn't help, you're probably running Internet Explorer 6 or Internet Explorer 7. I strongly feel that IE6 must die, and everyone should upgrade to Internet Explorer 8 or whatever else. It's very much broken, and it takes an awful lot of time for me to make the site work with IE6. Others just work. Some layout and placement problems are still there and I can't make them go away, since IE6 is buggy. IE7 has some bugs left, too, and IE8 is OK.
If you're running a modern browser and still see layout problems (or any other problems), please let me know through the google group.
The real-time map is slow
The map is quite heavy for the browser, especially when a lot of symbol graphics and track lines are visible at the same time. This application is simply quite complicated and heavy for being "just a web page". It is very hard to make this run smoothly on a slow computer. The aprs.fi servers are quite fast and optimised for the task, and the slowness happens generally only due to the slowness of the browser's Javascript engine.
If possible, try out another browser. Google Chrome and Apple Safari have much faster Javascript engines than Internet Explorer and Firefox. New Internet Explorer versions (IE8 and later) are faster than the older ones (IE6, IE7).
The map is faster when there are fewer markers visible – just try zooming in a bit. In Preferences => Filtering you can hide some target types you're not interested in. Selecting Show with track instead of Track + waypoints will hide the small red dots indicating transmitted positions along the track, which will reduce the amount of markers and might give a considerable speed-up.
Discussion group, blog and other points of communication
If you have any questions, answers, ideas, tips or tricks, please share them on the official aprs.fi Google Group. It's available as a web-based forum and as a regular mailing list. Before posting, please read the instructions on the forum's front page, especially the requirement for as many relevant details as possible (including exact callsigns and page links in question). The forum exists strictly for discussing the aprs.fi web service – please use the other relevant forums for discussion about generic APRS issues or tracker configuration problems.
News about the aprs.fi service are posted on the aprs.fi blog, which can also be subscribed over email, or using an RSS reader such as reader.google.com. Headlines from the blog are shown regularly in the lower right corner of the real-time map.
